So how does lightning locating work?
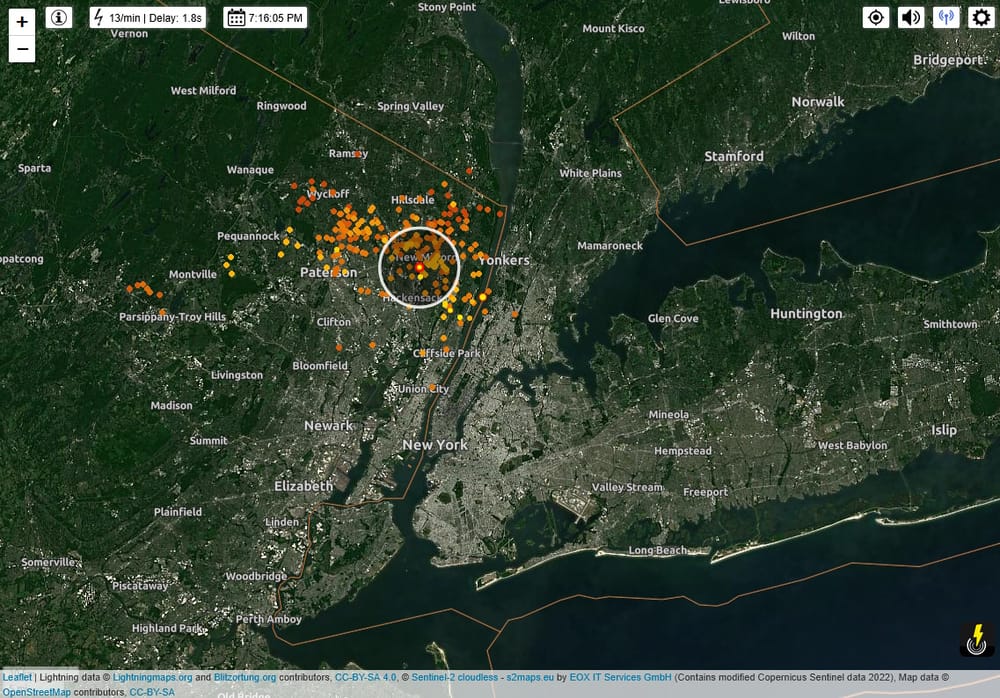
Every once in a while, I wind up posting screenshots from lightningmaps.org because I'm a nerd and am regularly amazed that we humans have the technology to accurate locate the location where lightning has occurred to within a few hundred meters ON THE ENTIRE PLANET, but we also provide that information essentially for free on the internet. On this particular day, the weather outside was warm(ish), stagnant, humid, the kind of summer weather where you expect a storm to go by soon. I could also hear repeated deep rumblings that weren't nearby traffic so I figured lightning must be going on somewhere nearby. So I checked the maps.
I wasn't surprised that there was a cluster of lightning to the north and west of the city. The only surprise was that it was very isolated, seemed likely to not pass overhead, and likely meant we weren't going to get a change in weather just yet. Maybe tomorrow things will improve.
But despite peeking at this service for years and years now, I still had no idea how it worked. So today we're going to do something about that!
So at a very high level, the Blitzortung network what backs this system is a large set of volunteer run stations scattered around the world. They use antennas to listen to the electromagnetic pulse of energy that lightning generates when it strikes (more on that in a sec). If four or more stations can detect the pulse of a lightning bolt, the timing and location data of the stations can allow the network to calculate the location of where the lightning was to within a few hundred meters. Super cool! But when you scratch deeper into how things work, it gets more interesting (at least for nerds like myself).
Detecting lightning pulses
The method that is often used for locating lightning now is based on "Time of Group Arrival (TOGA)" analysis of Very Low [Radio] Frequency (VLF, 3-30 kHz) signals. The paper "VLF lightning location by time of group arrival (TOGA) at multiple sites" by Dowden, Brundell, Rodger in 2002 describes the method.
The paper distinguishes this VLF method against an older method pioneered in the 1960s that used time of arrival (TOA) of Medium Frequency (MF, 0.3-3 MHz) signals. This older method detects the leading edge of the lightning pulse which sends these MF radio waves out. The problem with MF waves is that they attenuate significantly over long distances, so a lightning detection network uses about 100 ground stations to cover the US (the NLDN, which as NASA describes, is a commercial venture). While the US back in the 1960s can afford to place that many detection stations across the country, it may not be feasible for large areas with sparse population, including the oceans. (The modern NLDN as far as I know has kept up with the times and uses a mix of modern methods to detect where lightning strikes.)
In comes the VLF+TOGA method, because unlike MF, VLF in general can travel VERY far because the wavelengths are so large (10-100 kilometers) they can diffract around obstacles like mountains. More importantly VLF signals will also reflect off the Earth's ionosphere allowing them to travel far beyond the horizon via the "Earth-Ionosphere Waveguide". So in theory the pulse of a lightning strike can be detected a thousand kilometers away. These pulses of energy, called a "sferic" are what's being detected by the lightning sensors.
But things aren't as simple as the MF+TOA method. In the MF+TOA method, they use the leading edge of the energy pulse to calculate the time the pulse arrived. This gives them an accurate way to say "the pulse arrived at this moment". From there you can use relatively straightforward math to calculate the position of the lightning strike.
The VLF emissions used in VLF+TOGA is different in that a lightning pulse's VLF energy is spread across a broad spectrum of frequencies and the technique uses all that broad spectrum signal. While all the frequencies act as an identical pulse of energy right where the lightning strikes, the different frequencies travel at very slightly different speeds through the atmosphere. This causes what was once a crisp blast of energy to "smear" over time the further it gets from the original location to as much as over an entire millisecond. This makes it so you don't have a crisp "the lightning's signal reached us at exactly this time!" point to do your calculations with. That introduces systematic errors, as the author states below:
The trigger time, t_0, is an adequate substitute for the TOGA in some studies, but introduces both random and systematic errors. Random errors of up to 20μs arise because the trigger time is digitised in approximately 20μs steps, the reciprocal of the sampling frequency (some sound cards
sample at 48 kHz, some at 50 kHz). Systematic errors arise because the trigger threshold is reached earlier in the waveform of a strong sferic than in that of a weak sferic. A sferic from a given lightning stroke is strongest at the nearest receiver and weakest at the furthest receiver, producing an
early trigger at the closest and a late trigger at the furthest. - (p818, Dowden, 2002)
Note that for the speed of light in a vacuum, 1 microsecond of is roughly 300 meters, a millisecond is about 300km, and a nanosecond is roughly 30cm. So there's an error of 20μs from just a sound card's 48kHz sampling rate, but on top of that you have to deal with a VLF signal that may be smeared over a millisecond. Modern systems use much faster ADCs to collect data an order of magnitude or more faster, but back in 2002 that was the tech they were dealing with.
So how the heck can this VLF+TOGA system get more accurate? By apparently taking advantage of a mathematical property of how these VLF disperse as they travel through the atmosphere. I did my very best to understand the math but to be honest a large chunk flies over my head, here's my best grasp of what's going on.
- The lightning detector picks up a spike of VLF energy across a wide spectrum in a way that triggers it to record that a lightning event has happened at time T
- The "wave train" of VLF energy is spread across a bunch of frequencies and over an extended period of time, the system records all this and, for the frequencies we are interested in, it runs a Fast Fourier Transfer (FFT) on the signal to decompose it into a bunch of pure sine waves
- Because the VLF signals travel at very slightly different speeds over long distances, the different FFT components will show up as being in different phases at the time of measurement
- The system then makes a plot of Frequency vs Phase offset with Frequency on the x-axis, runs a linear regression on the plot. What we care about is the slope of that line.
- The slope of this line is essentially (radians)/(radians per second) = seconds
- The slope gives you the difference in time relative to your original measurement time T of when the center of the waveform's energy was detected
The physics behind the TOGA calculation is (apparently) a well known property in the physics of waves and dispersion going back a century or two. I wouldn't know because the last time I studied physics was back in high school multiple decades ago and this was most definitely Out Of Scope for what I took.
The innovation of VLF+TOGA when it comes to lightning detection is that it allows for stations to be spread much further apart while still detecting lightning with as much as 1μs accuracy according to Dowden's paper.
The VLF+TOGA method is what is used to power the WWLLN, the "World Wide Lightning Location Network". This network is run by roughly 70 sensors globally, and they say that if their sensors were perfectly spaced 3000km apart, they would only need 50-60 sensors.
But what if you don't want to do FFT calculations at each station?
Blitzortung decided to take a different approach to the problem than WWLLN. Because back when the project started in the mid 2000s, getting a microcontroller that could do all the FFTs and regressions for every lightning strike being detected over a very large detection area (a radius of thousands of kilometers) would have been a very expensive proposition and certainly outside the reach of a hobbyist. A big storm can register thousands of strikes per minute, each one would require all that calculation to be done.
How do they go about things instead? They've got a whitepaper describing it.
The gist is this, station owners build VLF antennas. This can be done with loops of cable in various orientations and shapes, or with much more compact ferrite rods. A vertical electrical antenna can also be used but it's noted that they're very sensitive to noise and placing them can be a challenge.
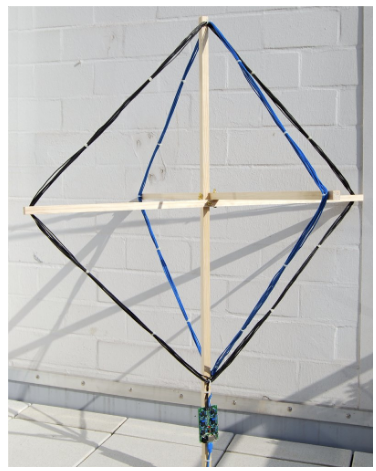
The antenna is connected to a standardized pre-amplifier design before being sent to a microcontroller board for processing. That same microcontroller board is connected to a GPS receiver. The microcontroller is responsible for taking the lightning signal, associating the waveform with the GPS time, and passes all that information back to a computer that takes and sends the data back to the network.
The GPS unit
When I started looking into the Blitzortung network, I had originally thought that the servers used NTP for time propagation, and I was very very wrong. The hardware requires the use of dedicated GPS receivers and actually get their time data from the GPS network. The hardware specifies the use of a GPS receiver with 1PPS (1 pulse per second) data output. Having just access to GPS itself is not quite enough.
What 1 PPS means here is that the GPS chip will send a brief pulse of electricity exactly when beginning of a second starts, which allows the lightning station to have a much more accurate idea of when a signal was actually detected. The 1 PPS signal is often accurate to within microseconds and will significantly improve the timing accuracy of the data the station sends.
For various technical reasons relating to exactly how the GPS modules are wired and signals transmitted, the network recommends certain specific GPS receivers for use on their network because they know how those specific devices work.
Avoiding TOGA calculations
Instead of doing the complex TOGA calculations at each station, the developers of the Blitzortung network leveraged the power of having a dense station network. TOGA is only required when the receiving station is very far from the actual lightning strike, because distance is what causes the VLF waves to spread out over time. A VLF detector that's within a few kilometers (or even ~300 km) of the actual lightning strike will pick up a sferic that is essentially still a single un-dispersed pulse of energy. That means the you can just use the much simpler time-of-arrival method to determine when the signal arrived at the station. Get a swarm of stations near the bolt all sending their GPS-timestamped signals together and you can calculate where lightning struck by drawing a set of hyperbolic curves based around those stations.
In order for Blitzortung to realize their vision, they have to place their detectors 50-200km apart, much closer than the 3000km spacing that WWLLN requires. They've gotten volunteers, very often at universities around the globe, to contribute to their project and this allows them the pretty great coverage that we see near populated areas. That said, the network does poorly for places like the Pacific ocean where there's there's no stations available for thousands of kilometers.
And there's other ways to measure lightning
Beyond these antenna based methods, there are satellites overhead that detect lightning over the planet. There's also magnetic direction finding (MDF) that detect the magnetic energy of a lightning strike, requiring only 2 stations to pinpoint a location. There's apparently even methods that map out the complex 3d structure of how the lightning channel develops and moves through the clouds (VHF Lightning Mapping Arrays).
And now, I've got one more silly piece of knowledge to tell stories about. =D
Standing offer: If you created something and would like me to review or share it w/ the data community — just email me by replying to the newsletter emails.
Guest posts: If you’re interested in writing something, a data-related post to either show off work, share an experience, or want help coming up with a topic, please contact me. You don’t need any special credentials or credibility to do so.
"Data People Writing Stuff" webring: Welcomes anyone with a personal site/blog/newsletter/book/etc that is relevant to the data community.
Counting Stuff Official Forums: Discuss posts, or other data topics with the community.
About this newsletter
I’m Randy Au, Quantitative UX researcher, former data analyst, and general-purpose data and tech nerd. Counting Stuff is a weekly newsletter about the less-than-sexy aspects of data science, UX research and tech. With some excursions into other fun topics.
All photos/drawings used are taken/created by Randy unless otherwise credited.
Supporting the newsletter
All Tuesday posts to Counting Stuff are always free. The newsletter is self hosted. Support from subscribers is what makes everything possible. If you love the content, consider doing any of the following ways to support the newsletter:
- Consider a paid subscription – the self-hosted server/email infra is 100% funded via subscriptions, get access to the subscriber's area in the top nav of the site too
- Send a one time tip (feel free to change the amount)
- Join the Approaching Significance Discord — where data folk hang out and can talk a bit about data, and a bit about everything else. Randy moderates the discord. We keep a chill vibe.
- Get merch! If shirts and stickers are more your style — There’s a survivorship bias shirt!