The Measurement of Loudness
I'm not a sound engineer of any sort, but I enjoy music and have been blessed with decent hearing acuity, so I tend to pay attention to noises going on around me. Now, I know what you're thinking! Surely, a measurement nerd interested in sound would have bought a cheap SPL meter off the internet and this is what this post is about.
And you'd be wrong! Hah! Because this post goes a bit further off the deep end because SPL and the dB(a) scales that we commonly associate with "sound volume" always confused me when I tried to understand them. Like with how measuring color is really difficult because it's at the intersection of a physical measurement and human perception (see: How the heck does one measure color?), sound is just as messy because it's again physical measurements (sound pressure) mediated by the human auditory system.
To measure loudness, we're going to have to go back a bit in history.
First came the decibel
As with a lot of audio signal technology, the history of loudness starts with the telephone systems and Bell Labs. Once you had a service that had to send electrical signals over long wires, you needed a language and units to easily discuss how much signal was coming through.
The decibel unit (dB) was adopted in the 1920s to replace an older unit of "miles of standard cable (MSC)" which represented the loss of power over a mile long piece of standard telephone cable. You could easily imagine a telephone tech at the end of a line taking measurements and saying that a line sounds like it had traveled through 15 miles of cable.
But once telephone systems got more advanced and it was possible to boost signals for longer transmission, engineers needed a way to both add and subtract signal. So they developed the decibel system because power and perception is more in line with logarithmic scales. It is a logarithm (base 10) of the ratio between two values (one being a reference point), 10*log_10(P1/P2), such that 3 dB difference between the two meant a doubling in power, so a 10 deci-bel difference (a.k.a. one Bel), is a full power of ten.
Incidentally, 0 dB SPL, is referenced against the sound pressure level of 20 micropascals, which is about the threshold of hearing.
In practice, it meant that phone engineers could listen to their reference tone from the central office (which was apparently set to 1000 hz because it's a round number in the target audio hearing range), then they listened to a closer reference signal and used calibrated attenuators (a bunch of resistors) to compare how much the signal degraded versus the reference tone.
But humans don't hear decibels
Pretty quickly, it was obvious that the human perception of loudness wasn't the same as the decibel unit's measurement of pure electrical power. The dB scale would predict something should sound twice as loud and humans would say it wasn't when it deviated from the reference 1000 hz tone that everything was tuned to. Depending on the frequency, it'd be perceived as softer our louder, but rarely "the same".
So more researchers at Bell Labs came up with another paper in "Loudness, It's Definition, Measurement, and Calculation" Fletcher and Munson, The Bell System Technical Journal, 1933. Here, Fletcher and Munson essentially tackled the problem of measuring how humans perceived the loudness of tones.
To jump to the conclusion, the two researchers developed a new unit called the phon. It is a unit of perceived loudness where 40 phon, by definition, is set to be equal to 40 dB SPL at 1000 hz. For all 1000hz tones, phon is the same as decibels of sound pressure. It is also a logarithmic scale and so if our hearing was magically the same at all frequencies, the phon and db SPL would be equal.
But phon and db SPL become different values when we're talking about different frequencies. The two scales are related by what's called the "equal-loudness contour" which is a set of curves that show how much db SPL is needed to sound the same as the reference phon. See the diagram below.
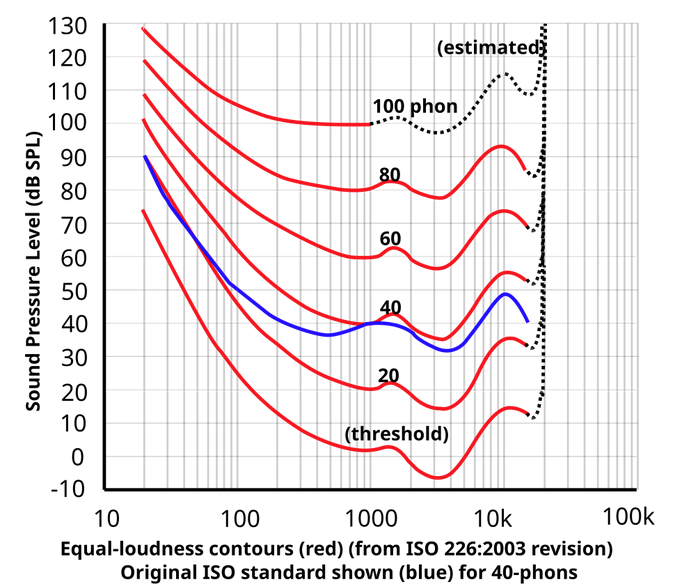
As you can see, each line essentially maps a level of sound pressure that "sounds equally loud". We are pretty bad at hearing low frequencies so it takes a LOT of SPL at the low end, and it sweeps downward as our hearing gets better at picking up sounds. Then the curves eventually sweep upward as we lose ability to hear extremely high values. Also note that the curves get flatter as we change from from threshold sound levels to extremely loud ones.
Most of the paper talks about the technical implications of measuring and then using the equal-loudness contour that was originally mapped by Fletcher and Munson. Meanwhile, what's of more interest to me was how they measured their initial contour (which isn't on the contour chart above, but was the predecessor of the ISO blue line). The methods of the development of the curve was tossed into Appendix A.
How to measure perceived loudness
The method used by Fletcher and Munson was relatively simple. Since this was a perceptual measurement, they needed humans to judge and report their perceptions about loudness. Since they worked for Bell Labs, they had access to the tone generating and measurement equipment used to diagnose telephony systems, and those were already tuned to generate various tones, including the 1000 hz reference tones used in their experiment.
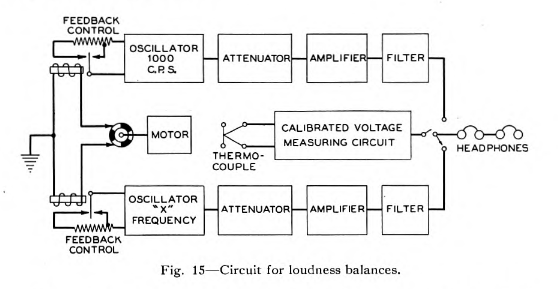
The general idea was simple, have a subject sit in a booth, have them wear headphones and listen to a test tone and a reference tone in quick succession. The subjects had to operate a switch that indicated whether they thought the test tone was louder, or softer, than the reference tone. Equal was not a choice, they could only pick louder or softer. There's a lot of little subtle experimental details they discuss that I won't go into, like accounting for subject fatigue, filtering out harmonics, distortion, etc.
Use this method across multiple subjects, over a large enough set of tines, and they eventually had enough data to figure out the median perception for various frequencies and the attenuations needed to bring a specific loudness value to the same loudness as the reference.
We've heard this before
While researching how the phon was measured, I couldn't help but think that I had heard an extremely similar story before.
If you look back at the color measurement post I linked to above, it describes the experiments the CIE did in the 1920s on the human perception of light and color. In those experiments, they had subjects sitting in booths and turning dials to make a test color equal in brightness to a reference color. Those data points were eventually used to derive the perception curves that form the foundation of how we perceived the brightness of various frequencies of light. That would eventually form the basis of color spaces and how we calibrate our many devices to reproduce colors.
Fletcher and Munson used a very similar setup about a decade later to develop the equal-loudness curve that defines the phon. Given the relatively close time relation between the two, I really want to say the color perception studies influenced Fletcher's thinking, but I can't for the life of me find any confirmation of the hunch. I even tried skimming through the Fletcher's 1929 book "Speech and Hearing" to see if there's any references to the CIE work, or even key words about light/color/anything in the text and couldn't find anything. It's entirely possible the researchers landed independently on the same overall framework to do this since it's one of the few ways you can experimentally come to the conclusions, but I'd love to know if they share direct inspiration.
And we get a Sone unit
While power and sound pressure are measured using logarithmic units for mathematical convenience, humans are pretty terrible at working with them at an intuitive level. So the "sone" unit that (approximately) linearizes the log scale for easier human consumption. 1 sone is defined as 40 phon. There's a formula defining the relationship, Sone=2(Phon−40)/10. Effectively, 2 sone is about double the perceived loudness, so is roughly 50 phon. It's a largely linear scale and makes things somewhat easier for us humans to work with using our mental arithmetic skills. It does break down a bit at the low ends, but in practical use that's not too much of an issue.
Honestly the only time I really encountered the sone was a year ago when I was searching for a kitchen vent hood and would sometimes hear loudness levels of the fan quoted in sone. It's also not as useful as it sounds because of its uncommon usage. It's still hard to picture in your head what "6 sone" feels like when reading a spec sheet. Regardless, the unit is still being used today!
From phons to the modern age
Phons were a good start at measuring loudness, but over time, people found ways to refine the concept. For example, later researchers found that our sound perception can differ when wearing headphones versus listening to speakers, because our heads and ears cast auditory shadows. Also curves had to be derived for different loudness levels because our hearing varies along that axis too. But eventually, the equal-loudness contours would codified into their own ISO standard (ISO 226). These equal-loudness curves then essentially get reused to calculate other scales.
The most commonly encountered scale related to 'loudness' is the dB(a) scale. In modern usage, sound meters don't give phon readings but dB(a). The dB(a) scale stands for dB SPL (A-weighting). The "weighting" here is actually the equal-loudness curve that Fletcher initially grounded at 40 phon = 40 dB SPL @ 1000 hz and had been refined into the ISO standard. Essentially, all the frequencies are weighted against the equal-loudness curve to model how loud a human will perceive all the frequencies added together.
One issue that you might have noticed is that the dB(a) scale was set at the 40 phon reference point, which was chosen for use in telephones as a reasonable reference point for having a phone conversation. You can see on the equal-loudness curves that our hearing perception shifts with loudness, so it's at best a flawed approximation that gets even more flawed when loudness goes higher. The phon system was also developed referencing pure tones and further research found that our perception of noise itself varies with frequency.
While no scale is perfect, one issue with dB(a)'s widespread adoption is that it became the standard where lots of safety regulations like OHSA were pegged to.
And there's also Loudness Units
The story of loudness doesn't stop at dB(a). If you play with audio recording and broadcasting to any degree (hey, everyone's got a podcast these days, right?) then you likely encountered yet another unit, LUFS (Loudness Units Full Scale).
The brief rundown of LUFS is that it's one of the "Full Scale" units, like dBFS, which is used in digital audio reproduction. Since digital audio has a fixed number of bits per frame to represent sound information, there's an upper limit to how much audio information can be encoded. Going past that means the audio gets that familiar "clipping" error. And so, the Full Scale units essentially measure how far away from the maximum sound level that can be encoded, which is defined as 0 dB of that scale.
The more important part is the Loudness Unit. At it's core, it's another measurement of how much sound there is, but instead of the somewhat outdated A-weighting of dB(a), it uses a more complex model of human loudness perception called K-weighting. Then there's a bunch of math and standards definitions going on behind the hood to arrive at a scale that audio software can work with.
The practical use of LUFS is in audio normalization – the act of adjusting the loudness of an audio track so that when one song or video switches to another, you don't have to change the volume on your speaker system. Older folk who used CDs or cassette tapes or made our own mix tapes would remember how you might have a quiet song that you turn up the volume on that changes to a loud track that suddenly blasts your ears to bits.
Most broadcasters and streaming platforms now have a preferred LUFS value that they normalize their audio to by default. For example, YouTube targets -14 LUFS (there's some complexity around it but close enough at a high level). Any video or song you upload can be mastered to whatever volume levels you want, but when the user plays the media back, the audio level is normalized meaning that if your track is analyzed to be "-10 LUFS", then YouTube will tweak all the audio by -4 LUFS so that you don't jump-scare their users. They might also boost overly quiet audio upwards in a similar way, though their specific process and criteria is unknown.
So what measurement thing did I get?
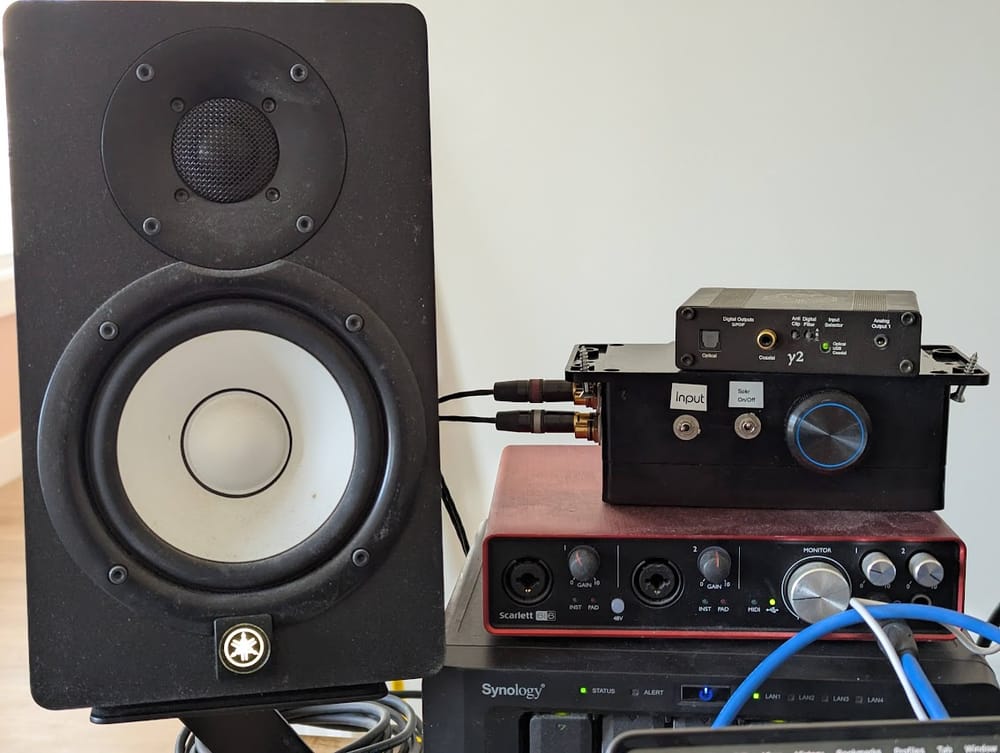
I mentioned that I didn't get a cheap SPL meter at the start because back then I didn't really understand all the stuff about dBa and loudness scales that I just wrote about. Instead, I opted to buy a USB-C calibrated mic (product page) that connects to my phone. I then use an app called Audio Tool that takes the mic calibration and can measure sound levels in dBa and show cool things like spectrograms. It's a lot more flexible than an SPL meter, and even comes with calibration details (which the cheap SPL meters won't have).
So, overall, those are the main ways that "loudness" is measured. It's still pretty confusing given all the different scales that are in play, but hopefully less mystifying than it was before.
Standing offer: If you created something and would like me to review or share it w/ the data community — just email me by replying to the newsletter emails.
Guest posts: If you’re interested in writing something, a data-related post to either show off work, share an experience, or want help coming up with a topic, please contact me. You don’t need any special credentials or credibility to do so.
"Data People Writing Stuff" webring: Welcomes anyone with a personal site/blog/newsletter/book/etc that is relevant to the data community.
About this newsletter
I’m Randy Au, Quantitative UX researcher, former data analyst, and general-purpose data and tech nerd. Counting Stuff is a weekly newsletter about the less-than-sexy aspects of data science, UX research and tech. With some excursions into other fun topics.
All photos/drawings used are taken/created by Randy unless otherwise credited.
- randyau.com — homepage, contact info, etc.
Supporting the newsletter
All Tuesday posts to Counting Stuff are always free. The newsletter is self hosted. Support from subscribers is what makes everything possible. If you love the content, consider doing any of the following ways to support the newsletter:
- Consider a paid subscription – the self-hosted server/email infra is 100% funded via subscriptions, get access to the subscriber's area in the top nav of the site too
- Send a one time tip (feel free to change the amount)
- Share posts you like with other people!
- Join the Approaching Significance Discord — where data folk hang out and can talk a bit about data, and a bit about everything else. Randy moderates the discord. We keep a chill vibe.
- Get merch! If shirts and stickers are more your style — There’s a survivorship bias shirt!
