Paper reading: analyzing string figures across the globe
Today is a bit of celebration on how it's fun to listen in on academics sharing their work. I happened to come across it on Bluesky randomly and thought it was fun.
The paper today, "A global cross-cultural analysis of string figures reveals evidence of deep transmission and innovation" by Kaaronen et al., 2024 discusses string figures. English speakers would probably recognize them from the game cat's cradle. It's an extremely simple game played with just a loop of string manipulated with the fingers (and sometimes other parts of the body like the mouth) to make patterns and shapes. People have noticed that many cultures across the globe have variations of the game and can create designs that are sometimes unique to some cultures while some other designs are very similar across multiple far flung cultures. Researchers have previously asked the question of whether these differences and similarities may be an artifact of cultural transmission or convergent invention but the problem at the time was that no one had developed a methodology that could analyze the highly complex patterns in a way that allowed such structures to be compared and analyzed. This requires significantly more computing power than readily available in the 19th century. This paper shows the results of one group that introduced a method to abstract the string figures into numeric sequences that could be analyzed using computational techniques.
The main body of the paper discusses primarily the possible implications of the analysis they did. For example they make arguments that some string patterns were transmitted culturally because the pattern and related variations are only common in one geographic region amongst neighboring cultures. Meanwhile they also argue that some other patterns might be very ancient because, despite their complexity, they're mostly made in the same fashion across cultures when an equivalent method of achieving the same result exists and is often unused. You would have expected more variation in methods if they had been arrived at independently.
The paper is interesting to read on its own since it bridges anthropological data from the late 19th century, extensive documentation of figures from citizen scientists, and mathematical techniques from knot theory and newly created R packages to arrive at a way to catalogue and a analyze patterns. The main body focuses more on the anthropological implications of the study, but I wanted to read more into the technical side. The code and datasets can be found in a supplement provided by the authors here.
Counting knots
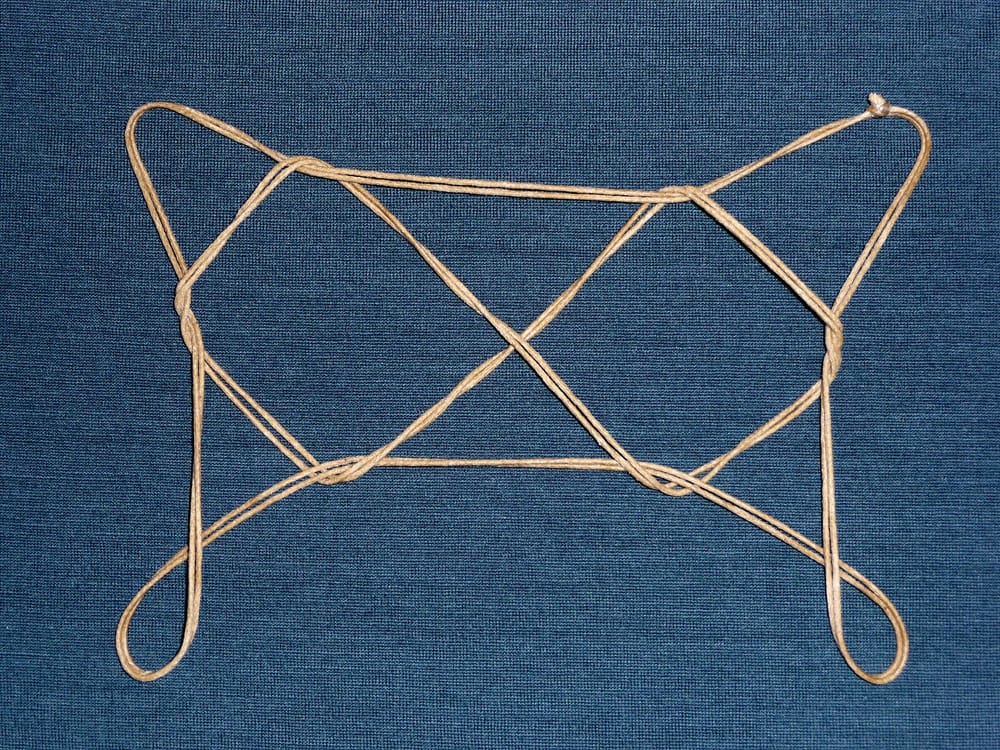
Knots are tricky things to study because the same knot made from a loop of string can be shuffled, stretched, and otherwise rearranged to look very different from itself. A naive person trying to make sense of knots could easily mistake the same knot as being different, while different knots as being the same. Luckily, mathematicians starting in the 1800s had been developing knot theory to study knots more formally, which eventually gives us the tools to describe knots put in use for the paper.
One interesting thing to note is that the string figures being looked at are all just twistings and interwtinings of a single loop of string, the unknot, and can always be undone without cutting the string. Topologically speaking, string figures are all the same knot. But the important piece taken from knot theory is the notation used for describing the knots because identifying whether a given knot is actually a form of the unknot has been a long and ongoing area of research.
The data
Before we get into how the researchers analyzed all the string figures, we should briefly cover the data they used. They used data collected by sources such as the International String Figures Association to find images of string figures. They took a maximum of 25 string figure examples from a cultural group (to prevent certain cultures from skewing the data with their more extensive records). There's also a bunch of reasonable limitations on which figures were included in the sample analyzed for the paper, including only taking records from before 1990 to exclude any potential effects of the internet spreading designs while potentially ignoring geography. All in all, they have a preliminary set of data that stretches across 826 string figures and 92 cultural groups.
Perhaps most surprising to me was the limit of 25 figures per culture since there could be potentially hundreds or thousands of designs. The selection of which 25 to include seems somewhat arbitrary, apparently based on the ordering of the source material they used. The authors state that many cultures only had about 10 or fewer figures recorded. With string being delicate and the figures themselves ephemeral, it's obvious that the record of figures is severely impacted by the lack of durable records. Even if they covered every recorded figure in existence, whatever they have would still be a skewed sample of the true number of figures ever created. The authors already note that they do plan on analyzing all the string figures that have been recorded, but it will take more time to do that analysis.
Gauss coding
The core notation technique used in the paper to classify the string figures is called Gauss coding or Gauss notation. It's one of many ways to describe a knot and is enough to get the job done for this particular work. The algorithm for generating a gauss code for a given knot is thus:
- Flatten the knot out on a plane, how this is done is arbitrary
- Pick an arbitrary start point anywhere on the knot
- Pick an arbitrary direction to trace the knot, clockwise or counter-clockwise
- Number the intersections as you trace the loop of string, 1, 2, 3, and so on
- If the string crosses over another string, that number takes a positive sign, if goes under, it takes a negative sign
- Continue until you return to the starting position
As you can see, there are many arbitrary things about the notation, especially surrounding selecting where to start and the direction to count intersections in. Every string figure, even the simples ones, will have multiple Gauss coded sequences associated with it simply by choosing a different start point or direction of counting. So one of the contributions of the paper is R code that will take one Gauss code for a figure, and generate all possible alternate codes for the same figure. A quick glance at the algorithm is about what you'd expect, incrementally shift the start point one crossing over and restart the whole procedure since the +/- signs will be consistent going the same direction. I haven't taken a deep peek at the code, but somehow they manage to use all the possible permutations of a given figure to relate to other figures.
Once all the figures are described using all those integer sequences, the authors then use what they call q-grams to analyze sub-sequences to find matches between figures. A q-gram is what most of us would call n-grams for text tokens, so [1,2,-3] is a q-gram of q=3, and so on. The authors mention that they chose q=3 for analysis since they consider 3 crossings to be the minimal unit of interest, but they say results are largely similar for q = 2 through 5, with 5 being more conservative about pattern matching. Once they have this big catalog of q-grams, they use the stringdist R package to do similarity analysis between the strings to see to what extent figures and sub-figures match using cosine similarity. Once the big cosine similarity distance matrix is calculated, the whole thing is clustered using R's hclust() for hierarchical clustering. As one final wrinkle, all the figures are associated with geographic locations, so they calculate a separate Haversine distance matrix to show how patterns are related to each other in space.
At this point, all of these methods probably sounds familiar to us data folks. The most novel bits involve calculating all the possible Gauss codings for every knot in the data sample.
The value is in the domain knowledge
As you can see, the data techniques used for this problem aren't unfamiliar to us. They're very standard techniques that we use all the time doing our normal data science work. The interesting parts of the research came out of applying the domain knowledge the researchers had about string figures to make sense of the output.
For example, they could take cues from how certain similar figures are named to give better strength to their arguments that the figure traveled through cultural exchange. Similarly, their domain knowledge allows them to make sense of a mistake in the transmission of a figure likely led to similar patterns existing in nearby cultures. If I had been handed this exact data set and asked to analyze it with similar techniques, I definitely would not be equipped to make such an observation.
And so, this is why I recommend people take a look at the paper. It's written in a very accessible way where even I could understand what they were discussing, perhaps because there's not a deep literature and familiarity with string figures. It's an interesting way to see how relatively pedestrian methods could be applied to a new domain to answer questions that were previously impossible to do.
Minor update, 2024-12-10: If you've got experience with computer vision models, or can develop a way to have a computer automate the gauss coding process, reach out to the author because they'd love the help! The manual labor involved in coding is the biggest bottleneck to analyzing the whole corpus of figures. That same model can also potentially help other string/cord/knot related research in other parts of anthropology.
Standing offer: If you created something and would like me to review or share it w/ the data community — just email me by replying to the newsletter emails.
Guest posts: If you’re interested in writing something, a data-related post to either show off work, share an experience, or want help coming up with a topic, please contact me. You don’t need any special credentials or credibility to do so.
"Data People Writing Stuff" webring: Welcomes anyone with a personal site/blog/newsletter/book/etc that is relevant to the data community.
About this newsletter
I’m Randy Au, Quantitative UX researcher, former data analyst, and general-purpose data and tech nerd. Counting Stuff is a weekly newsletter about the less-than-sexy aspects of data science, UX research and tech. With some excursions into other fun topics.
All photos/drawings used are taken/created by Randy unless otherwise credited.
- randyau.com — Curated archive of evergreen posts. Under re-construction thanks to *waves at everything
Supporting the newsletter
All Tuesday posts to Counting Stuff are always free. The newsletter is self hosted. Support from subscribers is what makes everything possible. If you love the content, consider doing any of the following ways to support the newsletter:
- Consider a paid subscription – the self-hosted server/email infra is 100% funded via subscriptions
- Send a one time tip (feel free to change the amount)
- Share posts you like with other people!
- Join the Approaching Significance Discord — where data folk hang out and can talk a bit about data, and a bit about everything else. Randy moderates the discord. We keep a chill vibe.
- Get merch! If shirts and stickers are more your style — There’s a survivorship bias shirt!