How much light was that?
I'll just briefly note that I am utterly horrified at what is going on w/ the US government right now. Between reading the news, stressful house stuff, and stressful work stuff, I might've stress-researched another metrology post this week.
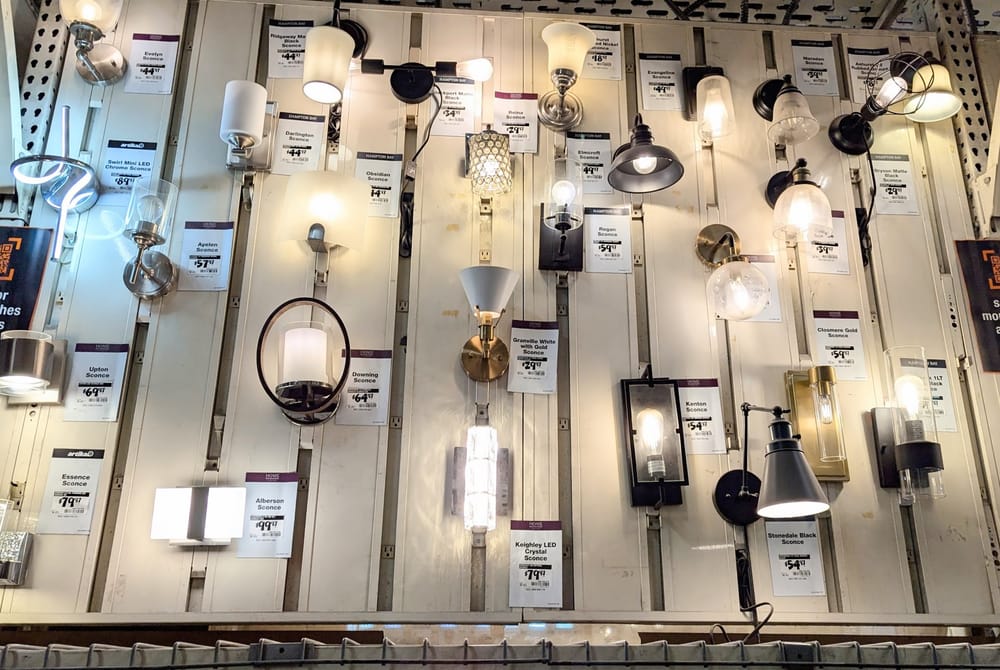
You can tell that I've been trapped in a special sort of torture chamber where I have to sift through thousands and thousands of lighting fixtures and try to decide what might be suitable for the home.
While I'm admittedly a measurement nerd, one of the things that I never really got into my head was how exactly light was measured or even marketed. Most of my understanding of light comes from working with my camera, which is primarily interested in color temperature and light bouncing off of objects. At best, my understanding of lighting was on the extremely consumer level of "bigger wattage equivalent, the more blinding the bulb". So, after seeing way too many fixtures, curiosity got the better of me and I wanted to know just how they measured how bright things were.
Starting with units
So the basic SI unit for measuring the amount of light coming out of a given bulb or fixture is the lumen. Specifically the lumen is a measure of luminous flux which is the concept of the amount of light (essentially how many photons in the visual spectrum) an object is giving off in all directions over a unit of time. This value is weighted to the human perception of light.
The weighting against human perception is important because our meaty photon receptors can only perceive certain wavelengths of light, and with differing levels of sensitivity at that. The unweighted measurement of this concept is called radiant flux and is essentially the sum of all the electromagnetic energy coming from an object and is measured in watts.
For a refresher on the how scientists figured out the function for human sensitivity for different wavelengths of light, I went into that rabbit hole on the topic of color measurement and the experiments used to define the perception curves below:

Converting from radiant flux to luminous flux involves applying a complex function that applies a conversion factor for every given wavelength so that things outside the visual spectrum like infrared get 0 weight, while green light at about 555nm where the eyes are most sensitive gets the highest weighting.
A bunch of units to handle
One problem with dealing with light is that there's a lot of considerations to untangle that result in related units.
For example, in photography, we care more about the unit lux, which is the amount of photons that are incident upon a surface (or exiting a surface). It's equivalent to lumens per square meter. We care because we want to know how much light is reaching the subject of the photo, which is correlated with how much light will reach our camera. We then would convert that amount of light into an exposure setting to capture the photo.
Meanwhile, the unit candela (cd) is used as a measure of luminous intensity, and is defined as lumens per steradian, where a steradian is the 3d cone equivalent of a 2d radian and is the solid angle with vertex at a sphere's center that cuts off a spherical surface area equal to the square of the radius of the sphere. You'll find fans of flashlights cite candela numbers as part of their discussion of specs because it acts as a proxy for how far a flashlight beam can throw into the distance.
Realizing the lumen
While knowing that the lumen is roughly a count of photons being given off by a lighting device, it doesn't really say much about how does one actually measure it and calibrate it to national standards. That would require a bunch of very specialized tools.
One of the more interesting tools used to measure how much luminous flux a light gives off is a thing called an "integrating sphere". An integrating sphere is a hollow sphere where the insides are coated with a diffuse reflecting material. The purpose of the sphere is that a light source can be placed inside (or a light is directed into the sphere from a port in the side). Light then reflects many times all around the sphere. An interesting property of the ideal theoretical integrating sphere is that with infinite reflections inside the sphere, any one point (or area) on the sphere's inner surface would have the same amount of light hitting it as any other point or area. The exact amount of light at each point varies due to many factors like the size and internal reflectance properties, but whatever you get should be the same at any point. This is great for measuring lumens because you don't have to consider the angle of the light with respect to your photodetector – the other way to measure lumens is to rotate a detector around your light source in three dimensions with a goniophotometer and take the integral of a bunch of tedious light measurements. The sphere does all the integration for you physically.
With the integrating sphere, you could take a standard light that you know generates a known amount of lumen, stick it in the sphere, and then swap the light to compare the relative difference in readings between the two lights. This method is used in the lighting industry as a form of quality control. There are other more complex setups that can be used to test the extent which an object reflects light, or laser output, and other things. Labsphere, a company that produces many products used in measuring light including integrating spheres has a nice short manual on the theory and applications of integrating spheres. I referred to it heavily while trying to make sense of the apparatus.
You can also see how NIST realizes the lumen (that is, to physically measure the unit) also uses an integrating sphere. The best I can make out of their terse description, when measuring how much the inside light bulb is giving off, they add in an external light source with known properties, and take a ratio between the total light inside the sphere and the light being introduced to get a reading within 0.50%.
NIST apparently designed their photometric realizations to be "detector-based" instead of the traditional "source-based" method. Meaning instead of the historic definition of a candela being related to a specially made candle that burns at a certain rate (and can degrade or have manufacturing variation over time) that would be used as a calibrating reference for your other tools, the detector-based methods use calibrated photodetectors with known characteristics that are more stable over time. All this of course is premised upon being able to build photodetectors that are very well characterized as to what their response is to different wavelengths of light.
So now we need really good light detectors...
How does one make a really good detector? Well, apparently the state of the art involves a device called a "cryogenic radiometer". At a very high level, it's a chamber that's designed to absorb as much light as possible at as many wavelengths as possible. Then the chamber is chilled to very low temperatures to reduce thermal noise. Light is shone into the chamber to be absorbed, and with the use of highly accurate thermometers, scientists can actually measure a change in temperature caused by all the light. Finally, scientists can let the chamber cool back down to baseline and then use electricity to heat the chamber to create an identical rise in temperature. Since scientists know exactly how many watts they put into the chamber to heat it up, this gives the equivalent wattage of all the light that went into heating the chamber originally.
When you have a chamber that can exactly measure the wattage of light, you can then place precise filters on the light and measure specific wavelengths. Do a lot of work with such setups and you can compare a photodetector against an array of absolute values to get precise characterizations of detector behavior. You can then take the calibrated detector and measure other stuff with it. You can even use something called a "tunable laser" that can create laser beams of varying wavelengths of light to scan a range of spectrum. It's nuts.
Even more nuts is how this setup was envisioned in what must have been the the middle of the 1900s because according to this paper abstract, the definition of the candella was modified in 1979 to allow for the use of cryogenic radiometers to realize that unit, which would then allow for the creation of precise photodetectors called "transfer detectors" that can be moved and provide their response reference points to other detectors.
Finally, back to buying lights
Now that we've dumped a bunch of units into our brains, how can we put them to use? Well, light sources like bulbs and LEDs are sold based on lumens, which measure how much light the fixture can pump out in all angles. Depending on the shape of the fixture, it can direct the light all in one direction like a spotlight, or more broadly like a light bulb to yield different intensities for the same lumens.
Next, the unit we probably care about in our space is lux, which talks about the amount of light incident upon a surface like our desk or book. That value in a room is determined by the specific configuration of lights in the room, how much reflection is happening, and the general size of the space involved. Which is why there's no real good rules of thumb to go by. It's probably safer to simulate the whole dang solution using lighting design software (like Dialux, Relux, or many other free or paid alternatives).
Or... just be like me and just do it from trial and error and copious use of return policies...
Sharing stuff:
Carl Pearson had published a post with lots of links to resources for people who want self-study about doing quantitative UX research. This newsletter even got a mention, being apparently one of the rare analytics-focused resources that isn't completely from a data science perspective. There's lots of really good resources linked so take a look at it.
Standing offer: If you created something and would like me to review or share it w/ the data community — just email me by replying to the newsletter emails.
Guest posts: If you’re interested in writing something, a data-related post to either show off work, share an experience, or want help coming up with a topic, please contact me. You don’t need any special credentials or credibility to do so.
"Data People Writing Stuff" webring: Welcomes anyone with a personal site/blog/newsletter/book/etc that is relevant to the data community.
About this newsletter
I’m Randy Au, Quantitative UX researcher, former data analyst, and general-purpose data and tech nerd. Counting Stuff is a weekly newsletter about the less-than-sexy aspects of data science, UX research and tech. With some excursions into other fun topics.
All photos/drawings used are taken/created by Randy unless otherwise credited.
- randyau.com — Curated archive of evergreen posts. Under re-construction thanks to *waves at everything
Supporting the newsletter
All Tuesday posts to Counting Stuff are always free. The newsletter is self hosted. Support from subscribers is what makes everything possible. If you love the content, consider doing any of the following ways to support the newsletter:
- Consider a paid subscription – the self-hosted server/email infra is 100% funded via subscriptions
- Send a one time tip (feel free to change the amount)
- Share posts you like with other people!
- Join the Approaching Significance Discord — where data folk hang out and can talk a bit about data, and a bit about everything else. Randy moderates the discord. We keep a chill vibe.
- Get merch! If shirts and stickers are more your style — There’s a survivorship bias shirt!