Half year of birb data collecting update
Winter is here and bird season by my office window has been winding down, and so I went back to the birdnet server I have running and checked up on the data it was collecting. (See link below for details on what birdnet is and how I set one up outside my window).
What's nice about running birdnet like this is that it provides a simple web interface to access the single SQLite table that is used to store all the detection data being generated. That means it's a very simple way to collect data to run analyses on! Anyone with an interest in collecting some personal data to analyze should consider putting together one of these things for the fun of it.
Now that I've collected about six whole months of data, across roughly three seasons, poking around becomes more interesting than when I first set it up.
Basic volume counts
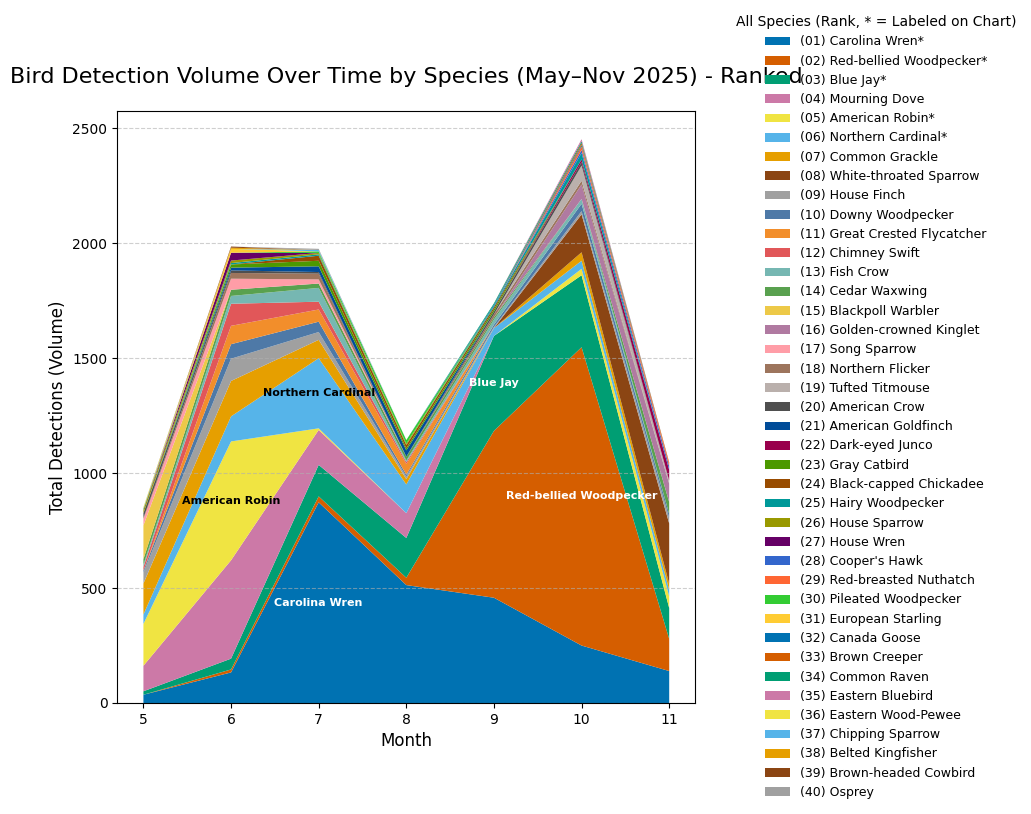
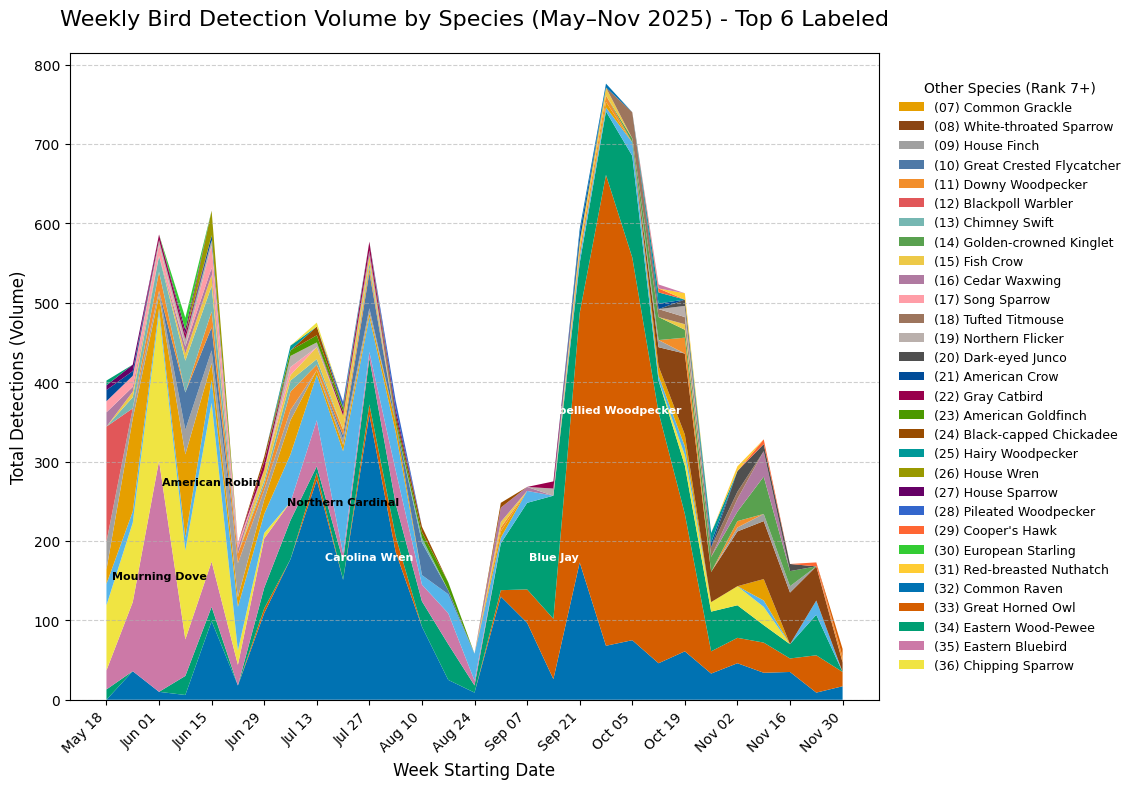
I didn't really know this until recently by looking at the data, but birds apparently sing more or less during different times of the year. Whether it has to do with mating, foraging, or migration activity is probably species dependent, but there are clearly a month or two where one specific bird is just making a ton of noise that gets detected by the system.
The detection counts also pretty interestingly has two big peaks, One around June/July, another around October. I don't have data from the earlier spring months of March/April/May yet, so the spring peak might shift earlier once that data comes in. Either way, the birds definitely quieted down in August for some reason.
The SQL query I threw together to do this is below, I'm being extra strict with the Confidence >= 0.8 bit, usually the system starts tracking a detection at 0.7 confidence. Using the higher threshold throws out over half the detection data.
select avg(case when Confidence>=0.7 then 1 else 0 end) as _70pct,
avg(case when Confidence>=0.8 then 1 else 0 end) as _80pct,
avg(case when Confidence>=0.9 then 1 else 0 end) as _90pct
from detections

## Results, reformatted
_70pct 100%
_80pct 46%
_90pct 14%
select
strftime('%Y', Date) as Year, strftime('%m', Date) as Month,
Com_name,
count(*) as detections
from detections
where Confidence >= 0.8
group by 1,2,3
having detections >=5
Monthly Birbs!
Bird migration signs
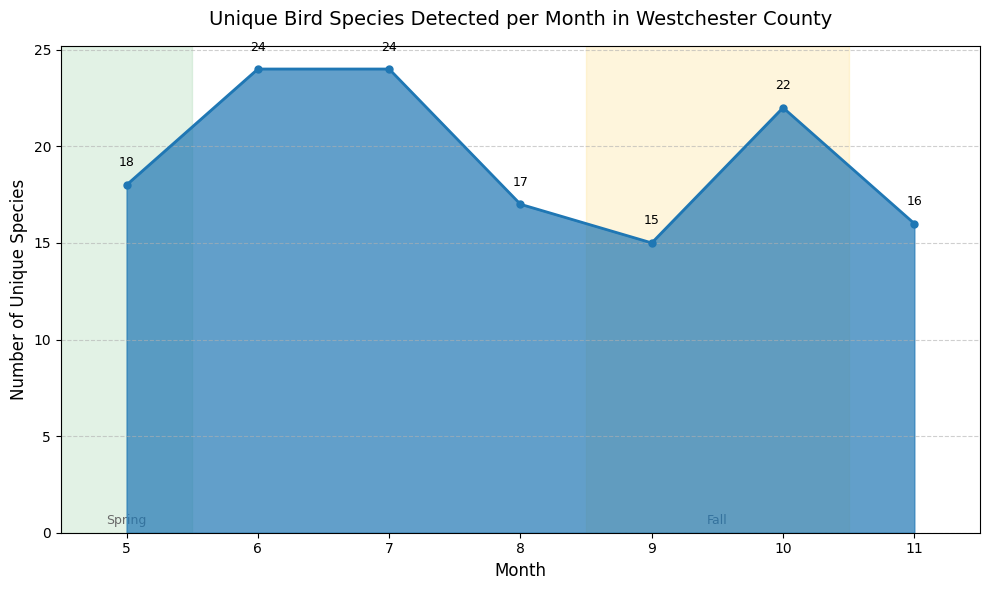
New York City being on the east coast means it sees quite a lot of migratory bird traffic. Being in the suburbs now also means there's a lot more trees around that attract various birds as they rest on their long journeys.
How that plays out is the number of unique bird species detected does show a bit of seasonal shifting. I'm pretty sure I missed the spring migration wave, so I'm looking forward to seeing that in the future.
Higher resolution data makes things even more interesting. There's apparently a handful of weeks where a red-bellied woodpecker must've been camped right outside and just filled the data before going off somewhere further away. It really shows how there's a lot of idiosyncratic stuff going on. There's a couple of smaller trees and bushes nearby, so any bird that particularly prefers that type of environment, or happens to just take up residence in them will be picked up a lot. Meanwhile, there's no body of water nearby so obviously waterfowl like the giant flocks of Canada Geese that pass through every season aren't stopping by my house.
So what sorts of birds showed up very rarely to my particular area? For some reason, sparrows! I hear whole colonies of them chirping up a storm as I go drop off the kid at school nearby, but for whatever reason the flock never makes it over to where we live. I did seem to catch a bunch of random birds that are likely common to the area but didn't really hang out where the system can hear them. I even caught some geese probably honking as they flew overhead.
select
Com_name, count(*) as detections
from detections
where Confidence >= 0.85
group by 1
having detections >2 and detections <= 8
order by detections asc

Com_Name	detections
American Tree Sparrow	3
Chipping Sparrow	3
Common Loon	3
Eastern Kingbird	3
White-breasted Nuthatch	3
Winter Wren	3
Brown-headed Cowbird	4
Eastern Wood-Pewee	4
Yellow-billed Cuckoo	4
Belted Kingfisher	6
Brown Creeper	7
Canada Goose	7
Eastern Bluebird	7
One thing I wonder is what would happen if I deploy multiple birdnet systems, like say one facing the front yard and one facing the back yards. When I was obsessing over clocks and time measurement, I learned that having one clock isn't interesting, they're only useful when you have two (even if one is the sun) because then you can make very interesting comparisons.
The detection neural net seems to be pretty willing to lower the confidence if there's noise like wind in the audio (it also automatically rejects anything that it thinks has human speech mixed in. I wonder to what extent would detections overlap between the two systems. I can imagine that certain calls that travel far, like geese overhead, could be shared, but things like higher frequency chirps might not. If I can find the spare hardware lying around, maybe I can try looking into this.
Anyways, hopefully other people will find this sorta stuff interesting and be inspired to try it themselves.
Stuff by other folks
A couple of weeks ago, my colleague Gabbielle was hacking together a tool to use LLMs to help tailer resumes against job descriptions and wrote a post about her experiences and thinking while building it. Since we're all UXers, there's focus on listening to user feedback, understanding what problems users are solving, etc.
She had also written a (sorta) followup to something she was talking about at dataBS-conf, about the stakeholder management, relationship building, and advocacy to finally push a good metric into being something that was adopted and useful and thus, impactful.
Standing offer: If you created something and would like me to review or share it w/ the data community — just email me by replying to the newsletter emails.
Guest posts: If you’re interested in writing something, a data-related post to either show off work, share an experience, or want help coming up with a topic, please contact me. You don’t need any special credentials or credibility to do so.
"Data People Writing Stuff" webring: Welcomes anyone with a personal site/blog/newsletter/book/etc that is relevant to the data community.
About this newsletter
I’m Randy Au, Quantitative UX researcher, former data analyst, and general-purpose data and tech nerd. Counting Stuff is a weekly newsletter about the less-than-sexy aspects of data science, UX research and tech. With some excursions into other fun topics.
All photos/drawings used are taken/created by Randy unless otherwise credited.
- randyau.com — homepage, contact info, etc.
Supporting the newsletter
All Tuesday posts to Counting Stuff are always free. The newsletter is self hosted. Support from subscribers is what makes everything possible. If you love the content, consider doing any of the following ways to support the newsletter:
- Consider a paid subscription – the self-hosted server/email infra is 100% funded via subscriptions, get access to the subscriber's area in the top nav of the site too
- Send a one time tip (feel free to change the amount)
- Share posts you like with other people!
- Join the Approaching Significance Discord — where data folk hang out and can talk a bit about data, and a bit about everything else. Randy moderates the discord. We keep a chill vibe.
- Get merch! If shirts and stickers are more your style — There’s a survivorship bias shirt!