Counting the planes overhead
Since there's quite a lot of weird down time during the job hunting/interviewing/resume-tweaking process, it gives me all sorts of downtime at home to indulge in my base instinct to... do nerdy things.
This week, I was unpacking a lot of the boxes from our old home (yes it's been over a year since we moved), and I found my RTL-SDR dongle. For context, RTL-SDR is shorthand for "a Software Defined Radio (SDR) that uses the RTL2832U TV receiver chipset". These relatively cheap ~$30 USB devices were originally designed to allow your PC to tune into TV broadcast signals, but folks figured out that the devices could actually receive a pretty wide range of radio frequencies. So people took the chips and built hardware and software to turn them into radio receivers that can tune all sorts of signals.
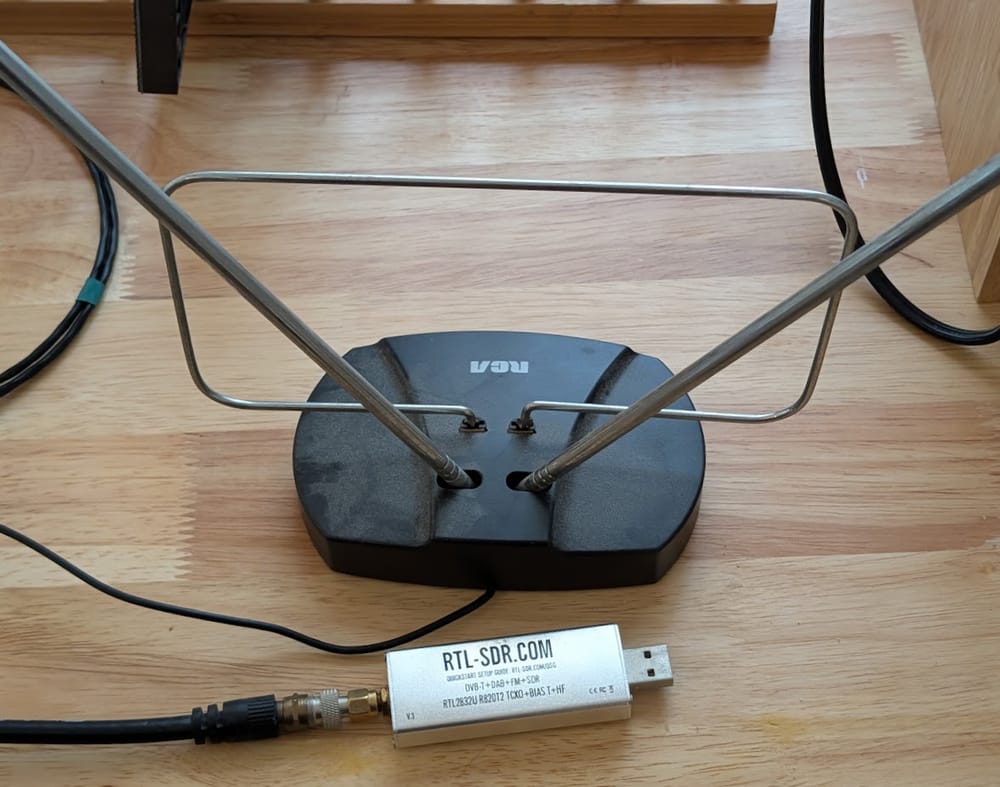
Incidentally, the one I own is an RTL-SDR v3 from these guys (not an affiliate link), which is about the cheapest you can get for a decent one that's not a weird bootleg. I then hooked mine up to a literal "rabbit ears" TV antenna I had bought years ago for a few dollars. I also put in a "TV antenna amplifier" to boost the signals I was receiving, which I had originally bought when I tried (rather unsuccessfully) to use broadcast TV from my NYC home. The amp isn't necessary, but it does help.
There's a bunch of things you can do with RTL-SDR with free software like SDR++, SDRSharp, and SDRAngel. For example, you can easily just scan the airwaves and tune into FM radio stations (AM is outside the receiving range of these dongles). I've also successfully listened in on pilots communicating with air traffic control at a nearby airport. I've heard chatter on police/fire frequencies, weird pirate radio stations, and random shortwave stations. If you've got a few dollars lying around and am curious about what's being broadcast around you, getting one of these cheap devices is a good investment.

Another thing you'll notice is that you'll sometimes hit upon frequencies that clearly have something broadcasting, but it's all beeps, boops or screeches, usually a sign that it's either data or encrypted signals being transmitted instead of voice. There's a lot of stuff going on out there.
Enter ADS-B
"Automatic Dependent Surveillance–Broadcast", ADS-B for short, is a technology system where planes can broadcast information about themselves to other planes and receivers, which then allows the planes to be monitored effectively. Prior to ADS-B, planes would be tracked via Secondary surveillance radar (SSR), where a ground-based radar system would blast out a particular signal sequence on 1030mhz as it sweeps. When the transponder on a plane receives that signal, it will respond with it's identity, heading and altitude on 1090mhz. These systems came from WWII era systems that were developed to distinguish friendly aircraft from enemies.
ADS-B improved upon SSR in that planes can broadcast a whole host of information about themselves, including it's identity, location (based off the plane's navigation system, or based off satellite location systems like GPS), altitude and airspeed. Unlike SSR that requires interrogation by a big radar system, ADS-B systems on planes just keep broadcasting messages out regularly on 1090mhz. That means that anyone, including a random computer with a RTL-SDR dongle, can pick up those signals!
People (and companies, and governments) who are obsessed with aircraft have created software that will collect, decode, and aggregate ADS-B data from around the world to provide information into air traffic. This is how services like Flightaware and Flightradar24 work.
Collecting ADS-B
This week was the first time I've ever collected ADS-B data, and so I had little idea what I was doing, especially with regards to making my radio software pick up and somehow decode the digital data being broadcast. Luckily, someone recommended I try the SDRAngel software, and it has a ADS-B configuration that is ready to go out of the box. It also has a "record data to CSV" function, which I happily turned on for a few days until my computer had a bunch of horrible crashing driver issues.
In the ~2-3 full days I had the software recording... I recorded about 22 million ADS-B messages. I live only slightly north of NYC proper, and we see a LOT of air traffic go by. I'm easily within the 'earshot' of the flight paths for the big tristate airports, JFK, LGA, EWR, as well as minor ones at TEB, and HPN. By my rough estimates, I saw roughly two thousand flights go by per day, with each plane blasting out multiple ADS-B messages regularly as it went by.
While sources on the web say that having an antenna of the right length so that it's tuned to the specific 1090mhz frequency (6.25cm for a 1/4 wavelength ground plane antenna), and located high and outside would give the best results. Supposedly for something like that you could potentially catch signals from just about anywhere within line of sight and hundreds of miles away.
I used instead a completely incorrectly-sized TV antenna, placed indoors by a window and managed to get signals within about 30-50 miles with the TV booster hooked up, and maybe 15-20 miles away without the booster. I was comparing against the live flightradar24 feed for my area and I did manage to see just about all the planes nearby with it.
Getting a bunch of planes while doing everything "wrong" by itself was pretty cool, but the real fun/pain/horror lies in trying to dig into the data.
ADS-B Data
In a nutshell, ADS-B data is a nightmare for an uninformed amateur to deal with. In fact, there's a really good free BOOK by Junzi Sun called "The 1090 Megahertz Riddle" that does its best to explain what the heck is going on in the scheme. We'll get a bit deeper into the weeds in a second, but imagine what my brain did when I first opened the CSV data I had recorded:
# Sample dump of the CSV data (read into python) from SDRangel
['Date', 'Time', 'Data', 'Correlation'],
['Tue Oct 28 2025', '00:30:42', '8d461f09f82300030049b84a30d7', '7.36257'],
There's a date and timestamp, great. A "correlation" parameter, which isn't clear what it is but appears to be related to signal strength. And finally there's just a hexadecimal code. That's it.
ADS-B's messages are represented as bits. There's complicated tables, rules, lookup tables, and other wild math and logic needed to make sense of what the bits mean. In theory it follows a technical specification, but as with all things it evolved over time and even more complexity got layered on as new needs were found. So the rules for interpreting the data is complex.
But luckily for us, the same person who wrote the book ALSO happens to have an open source ADS-B decoding package for Python, pyModeS. If not for this package I would've completely just given up on working with this data. You'll see why in a bit.
Some cute explorations
So there are many different types of ADS-B messages, designated by the "typecode". Obviously the data within each message will vary by type. But one thing that ALL messages have is the ICAO address. It's a unique 24-bit code that's assigned to a given aircraft when it is registered, often represented as a 6-digit hexadeicmal code. That ICAO address accompanies all the messages so that receivers can tell what plane the message belongs to.
For typecodes 1-4, you can extract out information about the plane's identify. Depending on what kind of plane it is, it has different values for the typecode and category. For example, a glider is typecode (TC) = 3, category (CA) = 1. "space or transatmospheric vehicle" is TC =3, CA=7. A heavy aircraft (over 136,000kg) is TC=4, CA=5. There's a big table of all this stuff that you need to reference. You'll also be able to extract "callsign" information, which we normal people would associate with the "flight number" of the plane we're boarding, like AAL3203.
One silly thing I learned while playing with the data is that callsigns will change when a plane lands and sets up to fly a different route, and so my naive counting of callsigns gave me a rough count of all the different flights going around nearby, but that's distinct from the count of unique airframes going by.


Dealing with position is hard
ADS-B relies on the sender to be the one broadcasting its position. Presumably it has access to GNSS navigation technology like GPS, so it should have a very good idea of where it is on the planet. But the messages also cover the case where GNSS data isn't available with the help of atmospheric barometers.
Messages with typecodes 9-18, are supposed to indicate that the altitude value is derived from the barometric altitude, while typecodes 20-22 are for when the altitude is derived from GNSS. The reason why there's a range of typecodes for all of these is because each typecode represents different levels of uncertainty in the position. Essentially, the lower the TC number, the more confident the message is of the plane's location. Depending on the code, it could mean as little as "within 7.5 meters horizontally" to "over 20 nautical miles (37km) horizontally".
The complexity in handling position is that they use a clever, efficient, but very confusing encoding scheme that involves the use of two slightly differently sized positional grids. A good description of this Compact Position Reporting is here, but the gist is that the plane will broadcast 2 different positional messages, which we can call "odd" and "even". Both of these messages divide the entire world up with two slightly different repeating coordinate systems and it reports its position within particular coordinate system. More concretely, imagine you overlaid a 10x10 coordinate grid on a piece of the Earth, then just repeated the 10x10 grid until the whole planet is covered, you can call this the "Even" grid. You then take a 9x9 grid and do the same procedure, calling it the "Odd" grid. A plane will then send two messages, saying they are at position (1,5) on the Even grid, and position (5,2) on the Odd grid. If the grids are sized correctly, there is only one single point on the whole planet where those two coordinate points overlap, giving the plane's global position.
But if you only have just one of the messages, either Odd or Even, you can also make a guess at where the plane is assuming you know roughly where to look for the plane by having a fixed position to reference against, since that would limit the number of places the plane could possibly be. The advantage of doing things this way is that it makes each individual message shorter, which is important since there's only so much bandwidth available to transmit bits.
All this is cool to know as a bit of trivia, but it means deriving position from ADS-B readings is annoyingly tricky. You need to find pairs of messages in the data stream and feed them into the relevant function to derive lat/lon values. pyModeS provides the functions that do the calculations for us, but we still have to isolate the correct messages to use. Fine if you're just processing the data in order in a pre-processing step and completely terrible if you're working on the data in a database.
Anyways, here's some very sloppy sketch code I used to mess with the ADS-B data I collected. Refer to the pyModeS docs for much more complete examples of how to use the library. I also originally thought I'd share some sample messages, but after further consideration, there's a lot of position data in there and it'd probably be a bad idea to post a bunch of random positional data that probably triangulates where my receiver is located on the internets.
So if you want to try playing with this data, there's some places to get free samples to play with – like here, here, and here.
But really, get a cheap SDR, it's fun for all sorts of novelty reasons.
# This is a code sketch of how some bits work and is not intended to run as-is

import csv
import pyModeS as pms

#original SDRAngel csv headers ['Date', 'Time', 'Data', 'Correlation']
ifile = csv.reader(open('my_data.csv','r'))

for line in ifile:
    outline = []
    msg = line[2] # actual ads-b msg
    if len(line) != 4: continue #invalid data
    else:
       outline += line #add original data
       outline.append(pms.adsb.icao(msg)) #ICAO is in every message, and unqiue to every plane in the sky

       typecode = pms.adsb.typecode(msg)
       outline.append(typecode) #Typecode is everywhere

       #The majority of the complexity of ADS-B hides within the typecode
       #ref: https://mode-s.org/1090mhz/content/ads-b/7-uncertainty.html
       #many types encode uncertainty information about the location/altitude

       #simplified pulling of certain values by typecode
       if typecode in (1,2,3,4): #identification
       # ref: https://mode-s.org/1090mhz/content/ads-b/2-identification.html
           typetext = "callsign"
           callsign = pms.adsb.callsign(msg)
           callfile.writerow([line[0],line[1],callsign])
       elif typecode in (5,6,7,8): #surface
           typetext = 'surface'
           surface_veolcity = pms.adsb.surface_velocity(msg)
           altitude = pms.adsb.altitude(msg)
       elif typecode >= 9 and typecode <= 18: #airbore, barometric height
           typetext = 'airborne_barometric'
           altitude = pms.adsb.altitude(msg)
       elif typecode >= 20 and typecode <= 22: #airborne GNSS height
           typetext = 'airborne_gnss'
           altitude = pms.adsb.altitude(msg)
       elif typecode == 19: #airborne velocities
           typetext='airborne_vel'
           velocity = pms.adsb.velocity(msg)
           speed_heading = pms.adsb.velocity(msg)
           airborne_velocity = pms.adsb.airborne_velocity(msg)

       outline.extend([typetext, callsign, surface_velocity,
         altitude,velocity,speed_heading,airborne_velocity])
ofile.writerow(outline)Standing offer: If you created something and would like me to review or share it w/ the data community — just email me by replying to the newsletter emails.
Guest posts: If you’re interested in writing something, a data-related post to either show off work, share an experience, or want help coming up with a topic, please contact me. You don’t need any special credentials or credibility to do so.
"Data People Writing Stuff" webring: Welcomes anyone with a personal site/blog/newsletter/book/etc that is relevant to the data community.
About this newsletter
I’m Randy Au, Quantitative UX researcher, former data analyst, and general-purpose data and tech nerd. Counting Stuff is a weekly newsletter about the less-than-sexy aspects of data science, UX research and tech. With some excursions into other fun topics.
All photos/drawings used are taken/created by Randy unless otherwise credited.
- randyau.com — homepage, contact info, etc.
Supporting the newsletter
All Tuesday posts to Counting Stuff are always free. The newsletter is self hosted. Support from subscribers is what makes everything possible. If you love the content, consider doing any of the following ways to support the newsletter:
- Consider a paid subscription – the self-hosted server/email infra is 100% funded via subscriptions, get access to the subscriber's area in the top nav of the site too
- Send a one time tip (feel free to change the amount)
- Share posts you like with other people!
- Join the Approaching Significance Discord — where data folk hang out and can talk a bit about data, and a bit about everything else. Randy moderates the discord. We keep a chill vibe.
- Get merch! If shirts and stickers are more your style — There’s a survivorship bias shirt!