Collecting Data
A reader, Alan, submitted a guest post about how they were collecting data, which is great because I have a bit of a rant that needs a few more days to brew. Enjoy!
I retired from being a Geophysicist doing oil exploration, and now do data science as a hobby. But much of what I did in my career would qualify as data science. In Geophysics there are basically three main specialties (I have done all three): data acquisition, data processing, and data interpretation. I believe these same three categories apply to any data science project as well. Data has to come from somewhere - whatever the project is. It is basically guaranteed that the data will have issues which need fixing - that’s the processing bit. And finally, of course, what does it all mean - where the rubber meets the road.
I thought I would talk a bit about my latest personal project - in particular about the data acquisition part, because there are a lot of decisions embedded in that step.
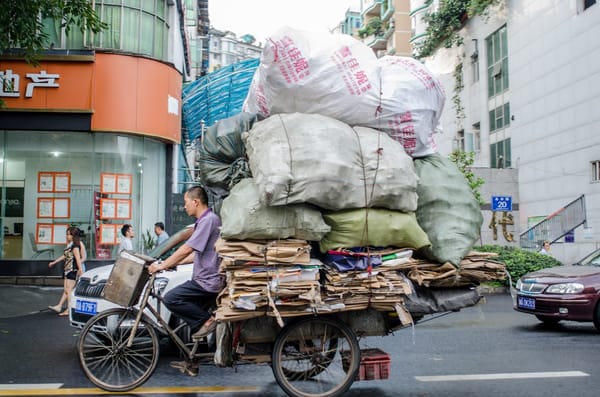
My wife and I like to take walks - usually 1-2 hours every day. In the past year or two, she has started picking up litter along our walks - carrying a grabber and a trash bag. Over about a year ago I started thinking that I wanted to capture the data about what and where she was finding litter, and analyze it for patterns. I wanted to capture what sort of trash she had picked up (McDonald’s cup, hard cider can, etc.) and where it had been thrown. But how to get the data? At first I thought I might use my phone to take pictures of each piece of trash, use the georeference data in the photo to post the location, and classify the litter after the fact. I did a similar thing a few years ago, evaluating the condition of the sidewalks in my neighborhood, and it worked fairly well, but did take quite a bit of programming to build the tool that let me categorize the sidewalks, not to mention chewing up a lot of disk space.
Which leads to one of the main topics I want to discuss - how does one build categories for data?
Classification
Often a key aspect of data acquisition is classifying the data points. After many years of working with, populating, and building databases, I have recognized that all classification schemes are doomed to fail at some level. There will be things that don’t fit the neatly built categories, and after much use it will probably become clear that some categories should have been split apart. I call this the library catalog problem. No matter what scheme (Dewey decimal, Library of Congress, ...) a library uses, there will be books for which their category is unclear or ambiguous. So I admit up front that my classifications will be deficient, and move forward anyway.
One key lesson I have learned is to plan on changing the categories early on as data gets collected and ugly reality intrudes on beautiful theory.
Initially as I thought about categories, I envisioned a pair of descriptors, something like
Composition:
- Paper
- Plastic
- Aluminum
- Glass
- Etc
Source:
- Fast food
- Spilled trash
- Unknown
But after I decided on a tool, these went by the wayside, for reasons that will become clear.
I had a brainstorm and realized that there might be a waypoint app out there somewhere that would fit my needs, and after a bit of searching, I found one.
GPSlogger for Android. The app is set up to annotate each waypoint with one of nine strings. So I installed it and started trying it out. I picked nine categories that I thought would be useful, and collected data for about a month. I then realized that the categories were not quite right, so I tweaked them, and have been using the second set ever since. Here is what the screen looks like:

FF stands for “Fast Food”, so McDonald’s cups, Starbucks cups, straws, napkins, etc. Junk food refers to candy wrappers and chip bags. And, of course there is the ever-present Miscellaneous. If I had a few more categories available I might add “clothing”, “poop bags”, and “drug paraphernalia”, but I don’t, so those fall into Misc.
Of course a database purist might object to my categories since clearly candy wrappers are also plastic or maybe paper, but I’m not trying to make exclusive, non-overlapping categories. Part of my motivation is to publicize the results to try to precipitate change, so calling out fast food and junk food in particular might have some effect.
A quick look using the new categories shows that they make sense - I think there is a reasonable balance between the numbers in each, and Misc is not overwhelming.

Location, location, location...
The app, very conveniently, automatically uploads the data in a variety of formats I can choose from to my Dropbox folder. It really is a well-written little app (I did contribute to the author’s coffee fund). Since I use R for my data cleanup and analysis, I chose the gpx format (basically an xml file), since there was an existing reader for it. I can already imagine some of the cleanup that will be required. The error in GPS locations usually averages about a 5 meter radius, so I can picture using GIS functions to create a new path in the center of a 10ish meter-wide corridor. To calculate things like the number of pieces of trash per distance walked I’ll also have to correct for backtracking done the same day. I’ve started this work, and the first thing I noticed was occasional spikes in the location data (the average distance between points is around 100 feet, but occasionally there will be a 1000 foot spike. So I wrote a little filter to identify and re-interpolate the location for spikes. Next step has been smoothing the path using a simple Gaussian kernel filter. At this point I’m still pondering where to go next. I’m not entirely happy with how well the paths track the streets, so maybe I’ll try downloading streets from Open Street Map, and then snap locations to the streets? But first I’ll go simple and just build a corridor around all the points and then make trash density maps in those corridors. Of course I also have the date and time, so it will also be possible to look at the time evolution of trash, and maybe correlate it with nearby events (we are close to a University, so... sports events?). Maybe a future post will go into these steps.
Subjectivity and Fat Fingers
The classifications are, of course, subjective. “Is that piece of paper a napkin from a happy meal or a piece of paper towel that fell out of a trash can?”. And I catch myself on occasion tapping the wrong button. So there is an inherent error-rate involved in my measurements, just due to subjectivity and fat-fingering. And I probably have a slight bias. I have noticed that I tend to hit the lower left button incorrectly (Plastic) more often than fat fingering other buttons. Just a reminder to almost never use more than 2 or 3 significant figures on measurement statistics. A lesson I had to really pound into my freshman physics students when I was in grad school. After decades of working with all sorts of data, one lesson I learned was to never get too hung up on one or two odd data points. Chances are they were in error. More than once I saw a colleague come to a foolish conclusion based on one bad set of data.
Takeaways
So a few takeaways from my data acquisition exercise.
- All categorization schemes are imperfect (but try to minimize Miscellaneous)
- Expect to rework the categories as experience is gained - it is an iterative process
- There are errors inherent in all measurements - as important as minimizing errors is understanding them - especially the difference between random errors and bias.
- Don’t try to be perfect. Start collecting data and update the strategy as you learn.
Alan Jackson is a fully retired Geophysicist, who studied Astrophysics in school, and now likes to noodle around with free online data to try to answer questions. I spent a lot of time in the COVID days working with that data, but have looked at crime data, solar panel installations, appraisal data, and other datasets. Often I’ll write up what I find on a blog, https://adelieresources.com/. Currently my main projects are trying to develop risk profiles for 162 churches in the Episcopal diocese of Texas for a dozen different climate-change-induced natural disasters, and looking for what the most vulnerable neighborhoods to flooding in the country are for Episcopal Relief and Development.